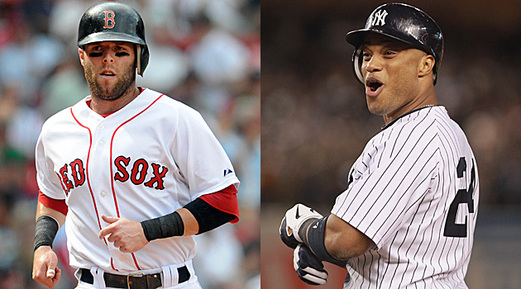
Although Robinson Cano may be having the better season, does Dustin Pedroia still claim to being the game's top second baseman?
Rivalry. The Boston Red Sox and New York Yankees have symbolized the meaning of this word for generations and generations. Within these two great franchises’ lies a smaller rivalry, between two players who happen to be among the best in baseball at the keystone. So, inevitably, the question arises: who is more valuable to their team, Robinson Cano or Dustin Pedroia? Each player is better than the other at certain aspects of the game, but we will delve further into the numbers to analyze these players a little closer.
Cano has played in more games than Pedroia, but they have both played long enough to take away averages and percentages of all their combined numbers. In order to compare these superstars, we will take a look at their average season of 162 games. Both guys own solid Triple Crown numbers with the pinstriped second baseman checking in at a .306 batting average with 23 home runs and 94 runs batted in compared to Pedroia’s line of .302/17/78. These more glamorous and “sexy” statistics are the old-fashioned way, and unfortunately, still popular way at determining the value of a player. The left-handed hitting Yankees second baseman has a beautiful swing that is perfect for the short porch at Yankee Stadium, so it comes as no surprise that he is considered one of the best hitters in the game. It is clear that Cano hits for a bit more power than Pedroia, with more home runs and a higher slugging percentage (.499 to .461). In addition, give Cano credit for staying on the field at great consistency. Pedroia has been pretty durable himself, but he missed the second half of 2010 with a foot injury and close to a month in 2012 with a thumb problem. Cano has played in at least 153 games every year since 2007.
Cano also has a step up in total bases, averaging 315 to Pedroia’s 296. But hold on; total bases only accounts for a player’s bases collected via the base hit (single, double, triple, home run). Walks, hit by pitches, and stolen bases are other ways a player can control of taking a base. When adding walks, HBPs, stolen bases and subtracting caught stealing (as a caught stealing loses a base runner for the team), Pedroia has Cano beat (382 compared to 359). Additionally, Pedroia simply gets on base more than Cano (.369 OBP to .349 OBP). When he does reach, it enables his team more opportunities to score runs. As evidence, Pedroia also leads Cano in the runs category (106 to 95). Dustin is more prone to swipe a bag as well, and he is able to do it at a very solid success rate averaging 19 steals and only being caught 5 times (79%). Cano only averages 4 steals while being caught 4 times; a poor success rate (50%). While on the topic of base running, we will glance at how many outs each player makes while on the base paths (OOB). Pedroia has made an average of 5.1 outs while Cano has made 6.1 outs. In such instances, a player is thrown out trying to advance an extra base. Shifting to more negatively viewed offensive statistics, Pedroia has Cano beat out in two categories that managers lose hair over. Dustin strikes out an average of just 63 times (8.7% of his PA) and Cano whiffs an average of 81 times (11.9% of his PA). Pedroia also grounds into less double plays than his counterpart in New York (14 to 21). This means Cano makes 123 outs for his team via the strikeout or double play, compared to Pedroia’s 91.
Let’s not forget the other side of the ball: defense. Pedroia can stop the “lasers” with the best of them too. Cano does not match up to the defensive numbers Pedroia has put up. Pedroia averages just 5 errors per season (.991 career fielding %), compared to Cano’s 10 error average (.986 career fielding %). Another very important fielding stat is Rtot, where Pedroia, in the average season, nearly has Cano doubled (8.3 to 4.8). This basically measures how many runs the player was worth based on the amount of plays they made. Now, to sum everything up, we look at three statistics that measure how valuable a player is to a team overall. Pedroia has Cano beat in all three: WAR (wins above replacement), Own% (offensive winning percentage), and WPA (win probability added). Pedroia averages a 4.3 WAR compared to Cano’s 4.1. Additionally, Dustin also has a .619 Own% while Cano owns a .588 Own%. Lastly, Pedroia’s 1.1 WPA once again edges out Cano’s 0.74. Robinson Cano has had a tremendous career in New York, but the scrappy, undersized dirt-dog at Fenway proves to be more valuable to a major league baseball team.
 RSS Feed